


 20 / 116

020
> General Content >
Trade Figures
Israel-India
> Business Guide >
2017
2007 2008 2009 2010 2011 2012 2013 2014 2015 2016
Importsof
goods
559 674 519 714 798 821 828 1,024 915 800
1,200
1,000
800
600
400
200
0
In Millions of dollars
Imports of Goods from India by Israel from2012 to 2016
(Excluding diamonds)
Processing and analysis: Economic Unit, Israel Export Institute
Sector
Description (M$ )
2015 2016 Percentage
Change 15/16
Percentage of
Sector in 2016
Chemicals
305 235
-23%
29%
Textiles
119 141
18%
18%
Plastics and Rubber
66 95
43%
12%
Electric Equipment
and Machinery
146 88
-40%
11%
Vehicles, Aircraft
and Sailing
Equipment
54 53
-1%
7%
Plants
59 44
-25%
5%
Basic metals
44 39
-11%
5%
Others
122 105
-14%
13%
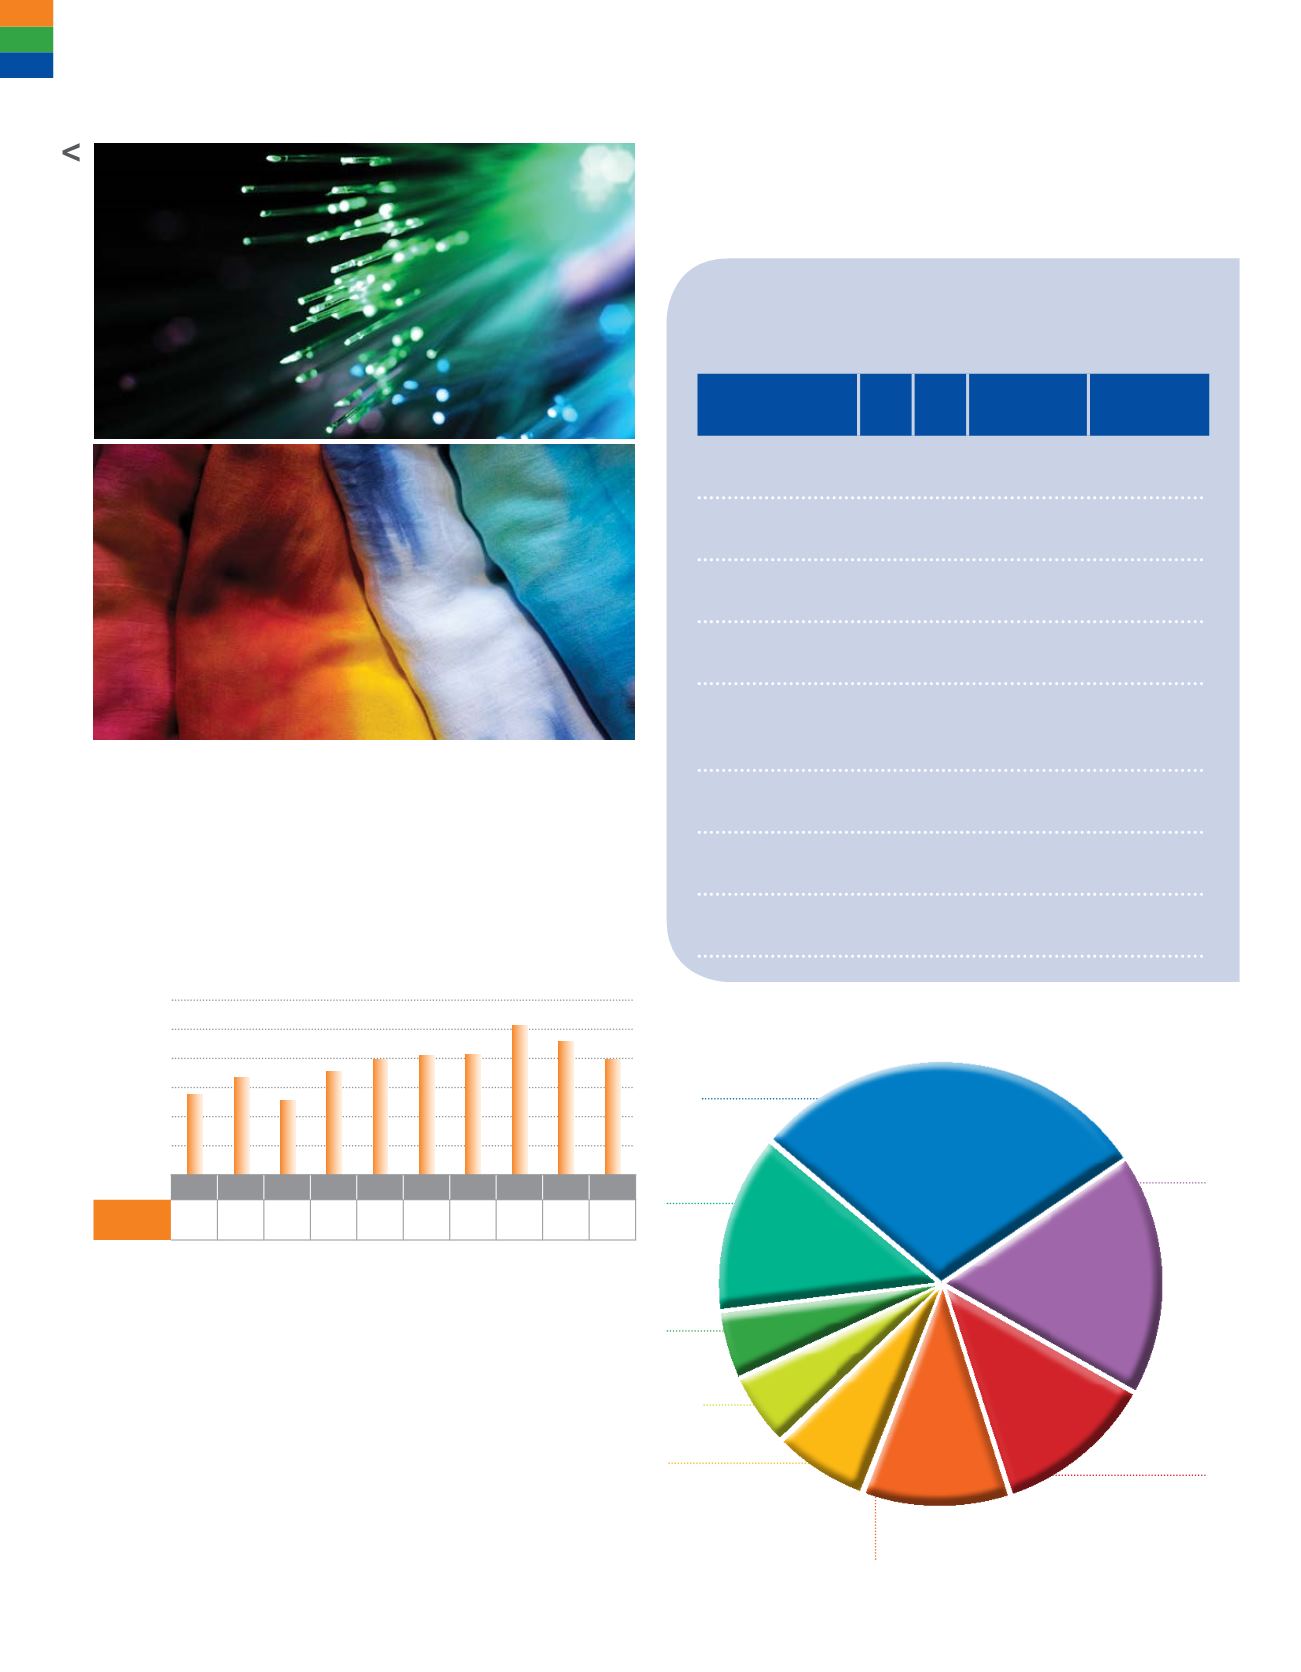
Major Sectors of Imports
from India by Israel
Israel’s Imports from India
Israel's imports of goods from India in 2016 registered a decrease
of about 13% to reach approximately US$ 800 million.This reflects
an annual decrease after imports fell during 2015 by about 11%. In
fact, despite the downward trend, the level of imports in 2016 was
similar to average imports during the period 2011-2013.
Israel imports from India weremainly Chemical Products (approximately
29%of total imports), Textile Products (about 18% from the total
imports), Plastics and Rubber (about 12% from the total import)
and Electric Equipment and Machinery (about 11% of total imports).
The decrease in the volume of imports in 2016 was mainly influenced
by the decrease in imports of chemicals (a decrease of 23% to
approximately US$ 235 million) and in imports of Machinery and
Electrical Equipment (decreased by approximately 40% to US$ 88
million). On the other hand, increases in imports of Textiles (rise of
18% to US$ 141 million) and Plastics and Rubber Products (increased
by approximately 43% to US$ 95 million) contributed to offset the
overall decrease in imports in 2016.
Processing and analysis: Economic Unit, Israel Export Institute
Basic
metals
Electric Equipment
and Machinery
Plastics and Rubber
Textile
Products
Chemicals
Others
Vehicles, Aircraft
and Sailing Equipment
Plants
29
%
18
%
12%
11%
7%
5%
13%
5%
Sector-wise Distribution of Imports from India, 2016