


 18 / 56

18
Megawatt-hours
(MWh)
annually.
When sectoring, Scenario One demanded 31% MWh
of the annual energy requirements while Scenario Two
demanded 67%.
Optimum PV system (scenario 3 vs. scenario 4)
In the previous analysis, the total energy requirements
were seen to reduce when the network was operated
in two irrigation turns
(two sectors)
, with the PV system
produced different results.
Scenario Three was used to evaluate the feasibility
of installing a PV system to supply the annual energy
requirements used in Sector One which produced 918
MWh annually.
In this permutation, Sector One would irrigate for a total of
twelve hours during the hours of sunlight, with the power
supplied by solar energy while Scenario Four was operated
solely at Sector Two, irrigating for 12 hours at night, while
consuming energy from conventional resources but taking
advantage of less expensive energy rates.
Contrarily, Sector Four was supplied with water using
solar energy in Scenario Two
(2,067 MWh annually)
while
Scenario One would irrigate at night.
In order to calculate the size of the PV array, the daily
energy requirements in the more restrictive month
(June)
were considered while Scenario Three was taken into
account to provide the daily energy demands for March
in Sector One of 6,751.4 kilowatt hour
(kWh)
daily and
scenario four for the daily energy demands simulated in
the Sector Two of 15,201.9 kilowatt hours daily averages.
PV production and purchased from the electricity supplier
as well as the balance between the annual energy demand
is shown in
Table Two
.
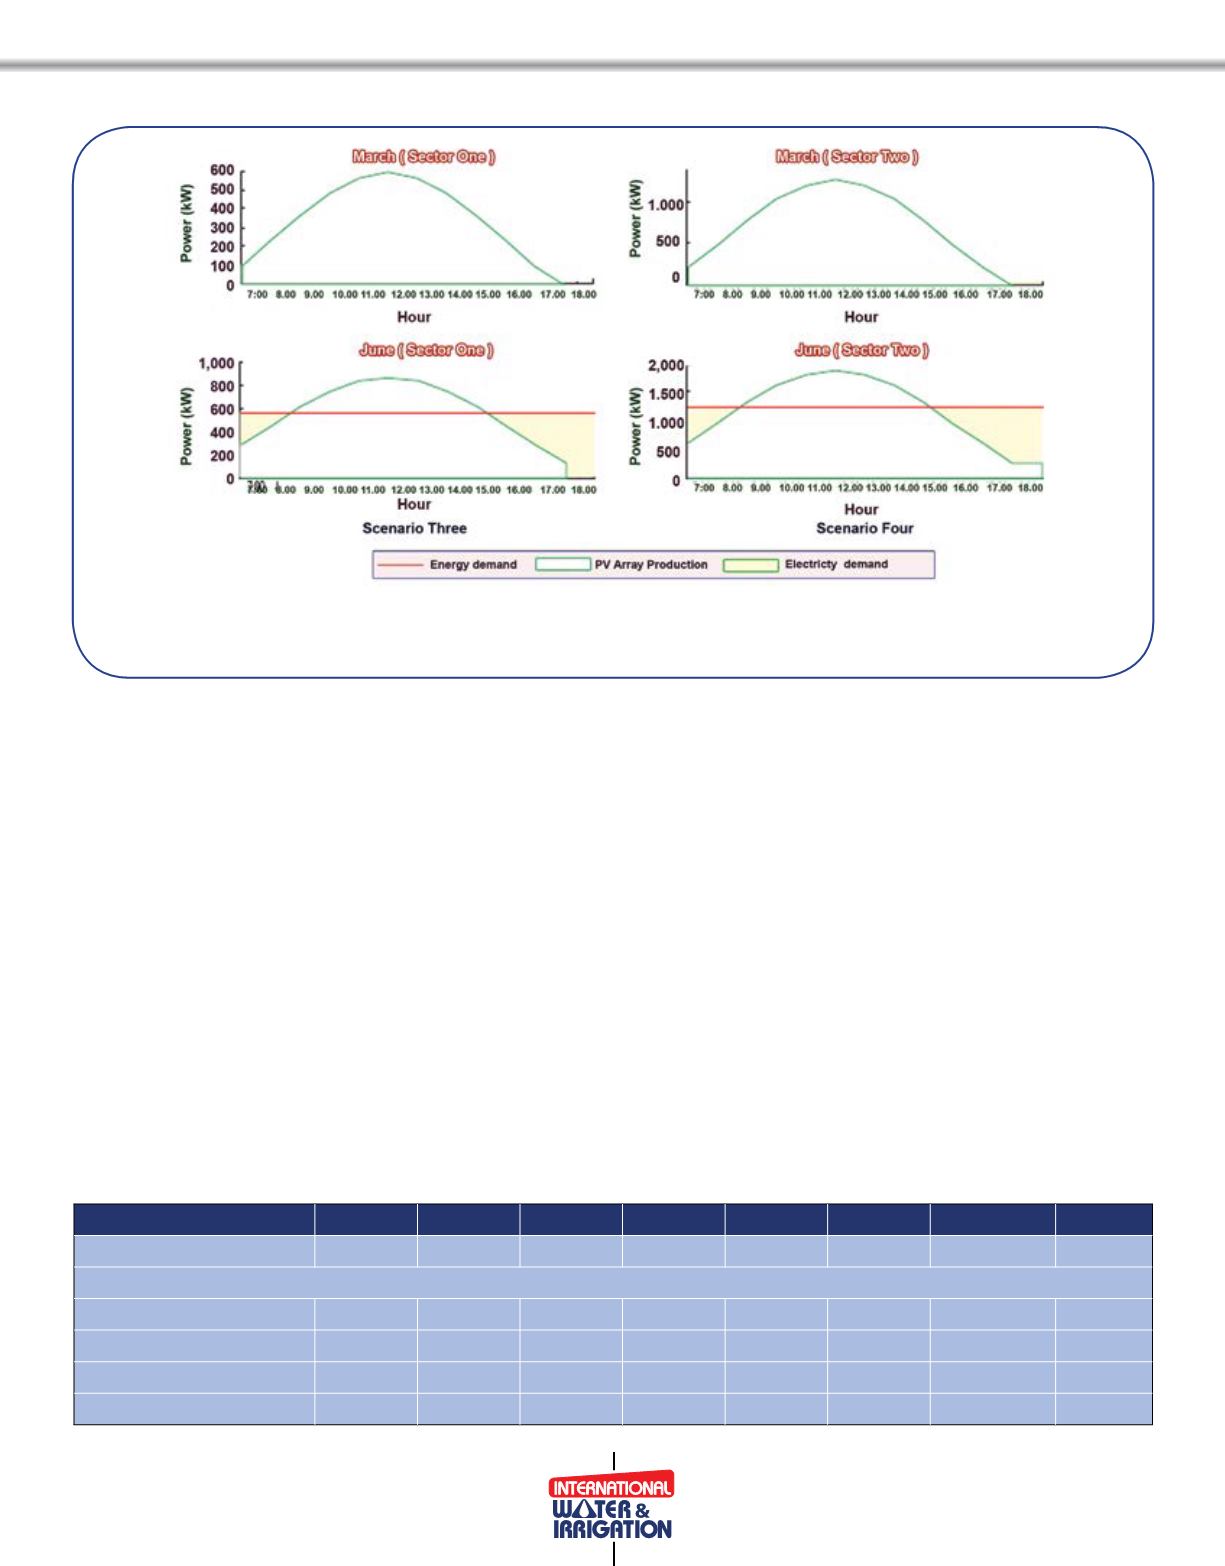
In these scenarios the energy produced by the 1MW PV
Figure Three:
Average hourly photovoltaic array energy production, pumping energy requirements (Sectors One and Two)
and external energy requirements for 1 MW (Scenario Three ) and 2.1 MW (Scenario Four ) solar photovoltaic systems
Table One: Average daily energy requirements (kWh daily) and potential energy requirements (%) for on-demand
(Scenario One) and for supply according to sectors (Scenarios Two, Three and Four)
March April
May
June
July August September October
Scenario One
1,511 13,458 24,778 31,789 30,867 25,152 12,139 1,478
Scenarios Two, Three and Four
Sector One
339
2,894 5,324 6,751 6,556 5,245
2,586
311
Sector Two
708
6,514 11,966 15,202 14.798 11,900
5751
726
Sectors One and Two
1,047 9,409 7,291 21,953 21,354 17,145
8,337
1,037
(30.7%) (30.1%) (30.2%) (30.9%) (30.8%) (31.8%)
(31.3%)
(29.8%)