


 54 / 64

54
XVHd E\ WKH inÀOWUDWinJ ZDWHU dXUinJ iUUiJDWiRn DSSOiFDWiRn RU
precipitation events without causing water logging, runoff,
or surface erosion.
Examples of soil physical characteristics as average
values for the 0 - 80 cm depth for the three measurement
standards used in the trial are as follows:
a) 27th July
- the average SMC was 19.35%
(39% of the
available SMC, or a corresponding soil matric potential
- SMP of 76 kPa)
in T1; 18.20%
(32% of the available
SMC, or 96 kPa)
in T2 and 16.40%
(22% of the available
SMC, or 161 kPa)
in T3. SMC values were not much
different from one another.
b) 7th August
- the average SMC SMC was 21.05%
(49%
of the available SMC, or a corresponding SMP of 53
kPa)
in T1; 16.7%
(24% of the available SMC, or 142
kPa)
in T2 and 15.10%
(15% of the available SMC, or
Figure Three:
Crop water stress index (CWSI) for peach
as: sunlit (South), shady (North) and average (East-
West) and using thermal images taken in late August of
the irrigation treatments.
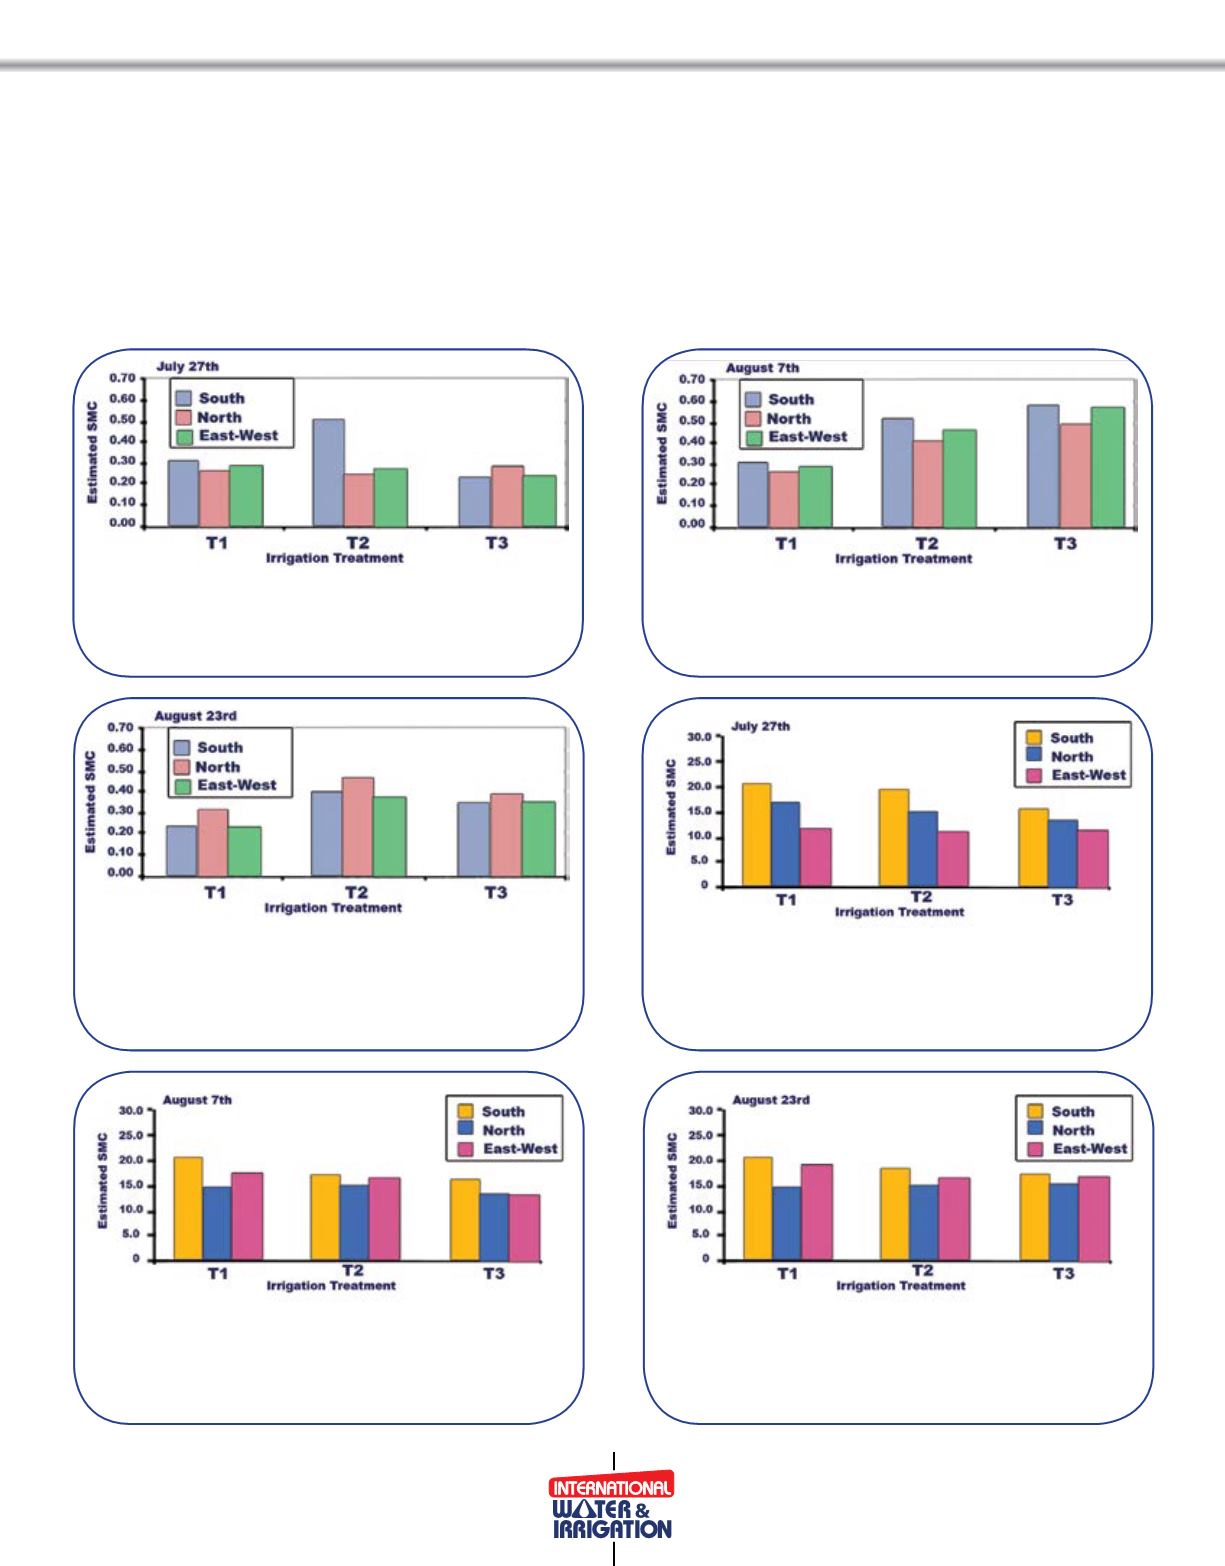
Figure Five:
Soil moisture content (SMC) as average
values over 0 - 80 cm depth for peach as: sunlit (South),
shady (North) and average (East-West) and using
thermal images taken in taken in early August of the
irrigation treatments
Figure Six:
Soil moisture content (SMC) as average
values over 0 - 80 cm depth for peach as: sunlit (South),
shady (North) and average (East-West) and using
thermal images taken in taken in late August of the
irrigation treatments
Figure Two:
Crop water stress index (CWSI) for peach
as: sunlit (South), shady (North) and average (East-
West) and using thermal images taken in early August of
the irrigation treatments
Figure Four:
Soil moisture content (SMC) as average
values over 0 - 80 cm depth for peach as: sunlit
(South), shady (North) and average (East-West) and
using thermal images taken in taken in late July of the
irrigation treatments
Figure One:
Crop water stress index (CWSI) for peach
as: sunlit (South), shady (North) and average (East-
West) and using thermal images taken in late July of the
irrigation treatments